In the Fall 2023, the City of Belleville contracted AET Group Inc to conduct a residential curbside waste composition audit which cost $78K.
The physical audit of curbside waste was done for 100 single-family households over a two-week sample collection period for each season. All curbside garbage, recycling and organics stream material generated by the sample households were collected and subject to waste composition analysis.
The audit consisted of a 2 week sampling period of 100 single family households each season and included the collection and sorting of:
- Garbage
- Recycling
- Organics
Audit finds 24% participation rate in green bin program
While Belleville single-family households are actively participating in and effectively utilizing the recycling program, only 24% participate in the green bin program.
In Belleville:
- 24% participation rate for the green bin program (organics) compared to 71% participation rate for blue bins (recycling)
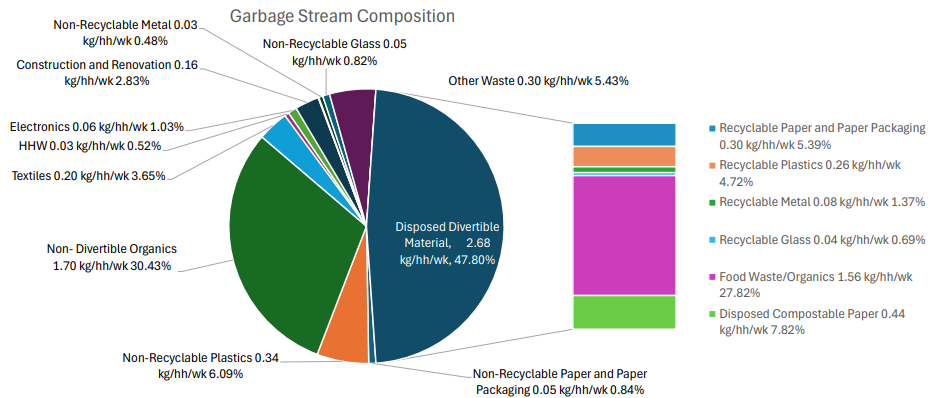
- 48% of garbage could have avoided a landfill (organic/food waste and recycling).
- 28% of garbage was food waste and organics
- 34% of food/organic waste is diverted from landfills, under the 50% benchmark set by the provincial government’s Food and Organic Waste Policy Statement
- 291.18 kg/hh/yr (5.60 kg/hh/wk) garbage generated per single family household
- Accepted green bin material was the largest disposed divertible component in the garbage stream at 35.64%, or 103.77 kg/hh/yr (2.00 kg/hh/wk)
- Compostable paper: 7.82% of the garbage stream 0.44 kg/hh/wk
- Recyclable containers: 4.09% of the garbage stream 12.00 kg/hh/yr (0.23 kg/hh/wk)
- Recyclable Fibres (including recyclable film) comprised 8.07% of the garbage stream, at 23.63 kg/hh/yr (0.45 kg/hh/wk).
- Total average green bin material generated by a single-family household of 60.08 kg/hh/yr (1.16 kg/hh/wk)
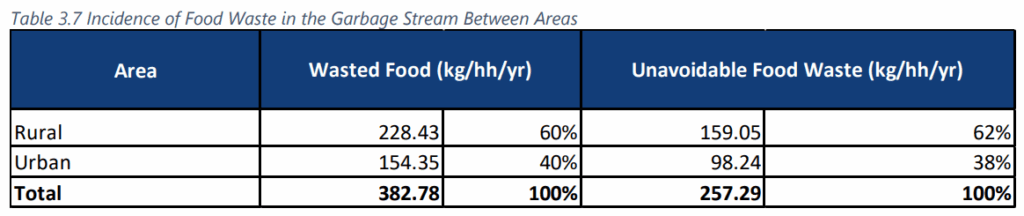
Rural households placed 50% more food waste in the garbage than urban households
Rural households accounted for 60% of the food waste found placed in garbage bags and placed around 50% more food waste in the garbage per households compared to urban households.
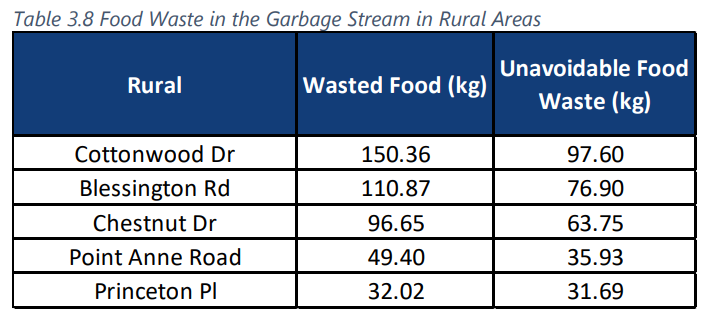
Streets with the highest levels of food waste placed in garbage bags in the “rural” area (Cannifton Rural to Urban tax billing area) were mostly found in the new, very nice Cannifton subdivisions north of the 401:
- Cottonwood Dr
- Blessington Rd
- Chestnut Dr
- Point Anne Road
- Princeton Pl
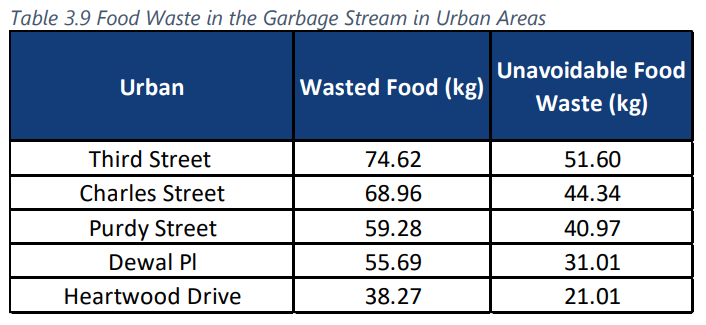
Urban areas
Streets with the highest levels of food waste placed in garbage bags were:
Considering that rural areas had the most amount of wasted food and unavoidable food waste in the garbage stream, this indicates a poor compliance with the green bin organics program in these areas. This could be due to a number of factors, including:
- Misinformation
- Lack of resources
- Potential animal problems with organic food waste. Animals may be a large contributing factor as they may cause a disturbance to bins or be a perceived problem when residents set out their household waste.
Belleville is required to divert 50% waste reduction of food and organic waste generated by single-family dwellings in urban settlement areas by 2025
Belleville is required to divert 50% waste reduction of food and organic waste generated by single-family dwellings in urban settlement areas by 2025 by the the Food and Organic Waste Policy Statement under the Resource Recovery and Circular Economy Act (RRCEA).
The City of Belleville currently diverts 33.88% of food and organic waste from landfills.
Belleville needs to ramp up diversion efforts or risk falling behind in compliance, resulting in audits, administrative penalties or other orders under the RRCEA.
Extended Producer Responsibility
Ontario’s Extended Producer Responsibility (EPR) shifts full financial and operational responsibility for packaging waste onto producers. Businesses responsible for supplying recyclable packaging are financially responsible for the end-of-life management of these materials. EPR is being phased in from 2023 to 2025, with full implementation by January 1, 2026.
While this means that the City will not be financially responsible for the disposal of recyclable packaging, it is still vital to ensure that all divertible recyclables are being correctly diverted within the City’s curbside diversion programs.
Consultant recommendations
Recommendations include enhanced public education, targeted rural outreach, possible changes to the waste collection schedule, and a review of existing waste bylaws.
Enhance Waste Diversion Programs
Improving waste diversion involves expanding the separation and collection of recyclable and compostable materials to align with best-case management practices. Programs can be enhanced by offering educational initiatives to promote proper waste segregation.
Collaboration with local waste management providers can further increase efficiency and engagement. These efforts collectively minimize the volume of waste sent to landfills, reducing associated emissions.
Adopt Circular Economy Practices
Circular economy strategies focus on maximizing resource efficiency by promoting reuse and recovery. Initiatives such as donation programs for reusable items, material repurposing systems, and take-back programs for products can greatly reduce waste. Partnerships with recovery-focused industries can help reclaim valuable resources while minimizing landfill contributions. By integrating these practices into operations, it can assist in moving closer to a zero-waste model.
Regular Monitoring and Reporting
A robust monitoring and reporting system is critical for tracking the effectiveness of waste management efforts. Digital tools or software can be used to measure key metrics, such as diversion rates and landfill contributions. Frequent waste audits allow Cities to track changes in waste trends and monitor the effectiveness of initiatives. It is recommended that waste audits are conducted with as similar parameters as possible every few years. A sample size of 100 households over 4 seasons is the industry standard for ensuring adequate data.
Staff recommends hiring a new employee to oversee waste management initiatives at a cost of $100K/yr
Without doing a full review as recommended in the audit report, staff is estimating that the recommended resources likely will require the hiring of a staff member to oversee these type of initiatives, at an estimated annualized cost of $80,000, and approx. $20,000 in marketing, and mail-out costs. After staff evaluates internal operations and opportunities, there are likely some other initiatives that align with waste and other environmental related projects that could be achieved with a new position.


Comments
We want to hear from you! Share your opinions below and remember to keep it respectful. Please read our Community Guidelines before participating.