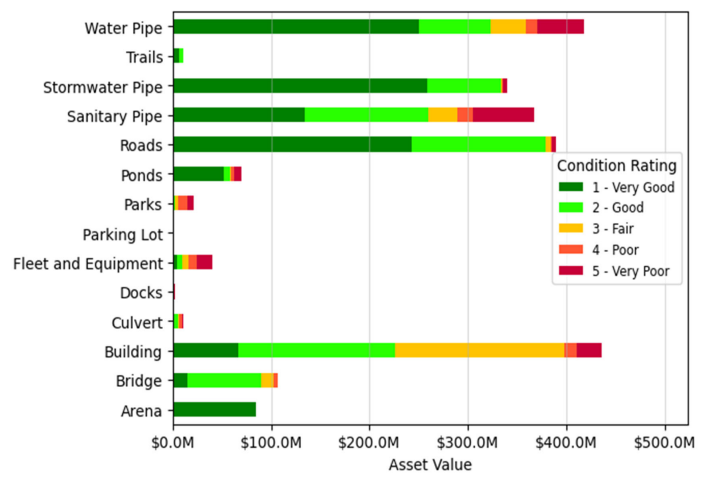
The AMP describes the replacement value, physical condition, and relative age of the City’s asset portfolio, organized by asset category. The assets that the City owns have a total replacement value of approximately $2.3 billion, as shown graphically below, organized by asset category.
Belleville’s assets are in ‘good’ condition
The City’s assets are in GOOD condition, with over 77.8% percent of the City’s assets in fair or better condition, which is referred to as a “state of good repair”:
Average infrastructure gap of $55.2M per year
Approximately $234.7 million worth of the City’s assets, or 10.1% of the portfolio’s value, are shown in poor or extremely poor physical condition and are approaching “end of life”.
To maintain the current level of service will cost the City $110.4M per year, which indicates an infrastructure gap of $55.2M per year or or a Funding Ratio of 0.5.
To bridge the gap, the options are:
- Increasing revenue (raising property taxes)
- Accepting increased risk
- Accepting lower level of service
2020 statistics
Water
- 76% of properties are connected to the municipal water system.
- 99% of properties have fire flow available.
- There were 0.004 boil water advisory connection-days per property.
- There were 6.67 water main break connection-days per property.
Wastewater
- 75% of properties are connected to the municipal wastewater system.
- 5 events where combined sewer flow exceeded capacity.
- 15.83 wastewater backup connection-days per property.
- 12 effluent violations due to wastewater discharge.
Stormwater
- 94.6% of properties are resilient to a 100-year storm.
- 99.5% of the stormwater management system is resilient to a 5-year storm.
Roads
- 0.22 lane-kilometres of arterial roads per km2
- 0.46 lane-kilometres of collector roads per km2.
- 1.09 lane-kilometres of local roads per square km2.
- The average pavement condition index for paved roads is 83.
Bridges & Culverts
- 0% of bridges have loading or dimensional restrictions.
- The average bridge condition index is 74.1.
- The average condition index for structural culverts is 67.5.


Comments
We want to hear from you! Share your opinions below and remember to keep it respectful. Please read our Community Guidelines before participating.